Benefits of having a Custom Report in Business
Custom reports provide businesses with a valuable resource for obtaining personalized insights that support strategic decision-making. Unlike standard reports, they are designed to address specific business requirements, enabling organizations to monitor key performance metrics, identify trends, and evaluate data that align with their objectives.
Custom Report Categories
- Sales Report
- Payment Report
- Product Report
- Customer Report
- Location Report
- Register Report
- Supplier Report
- Pricelist Report
- Purchase Document Report
- Inventory and Inventory Document Report
- Gift Card Report
- User and User Group Report
- and many more
Where to Find the Custom Report
- Navigate to the Reports tab at the top of the page in Erply's Back Office.
- Find and select "Report Generator" from the menu on the left side.
How it works
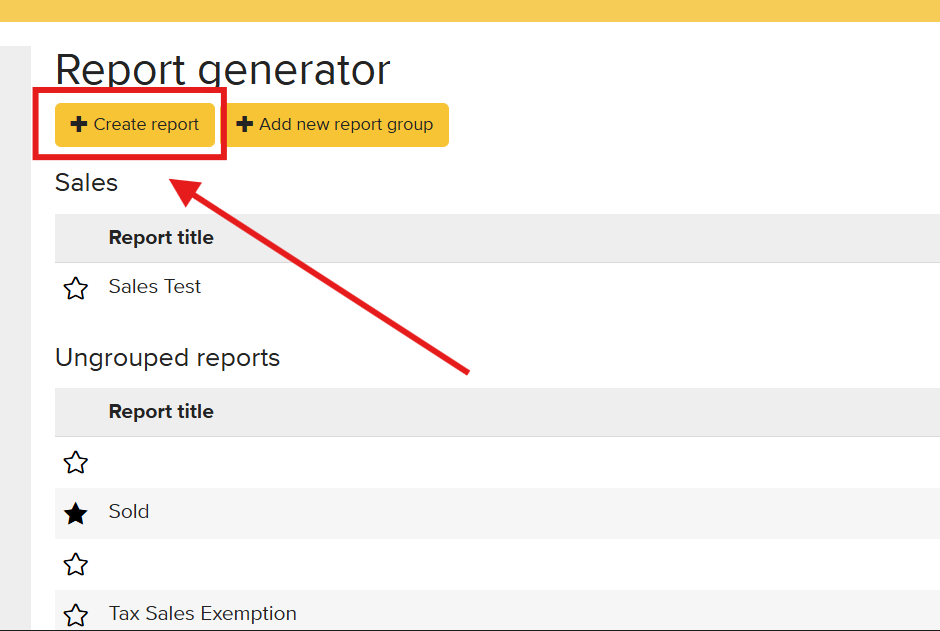
On the Report Generator page, you can:
- Create a new report
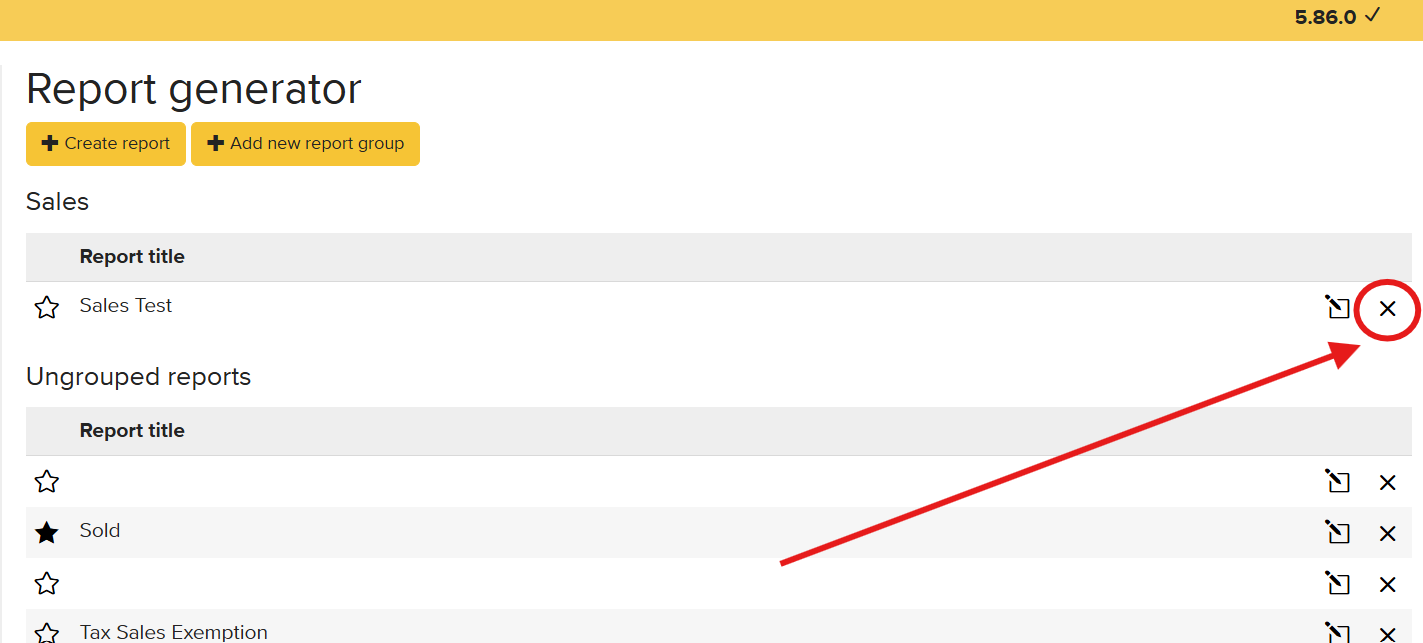
- Delete a report
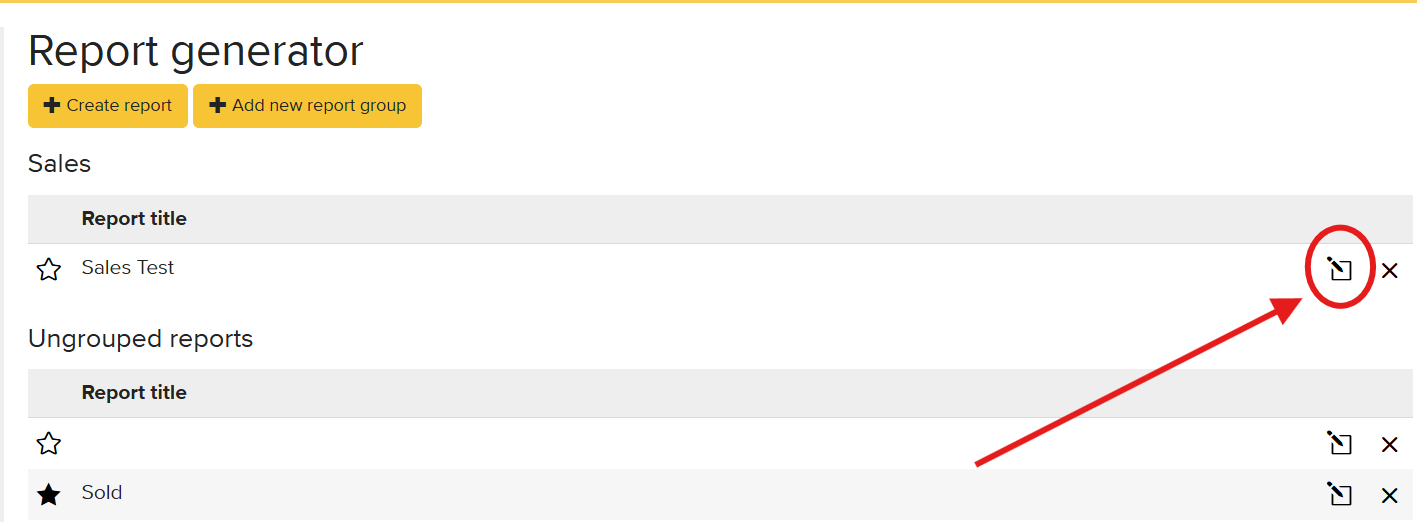
- Edit an existing report
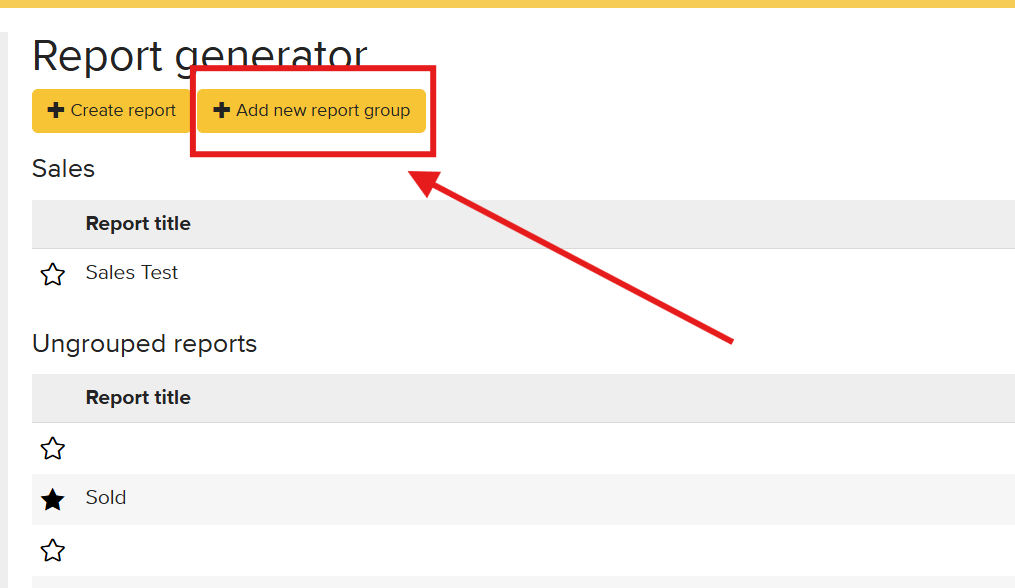
- Group the reports
How to create a Custom Report
When creating a custom report, you can choose from various tables such as Product, Customer, Sales, Sales Document Row, Inventory, Supplier, and more. Tables can be combined as long as they are logically connected. However, selecting unrelated tables is not allowed, and the system will display an error message: "Report contains an error - selected tables cannot be joined."
For instance, Customer and Product do not share a direct connection and cannot be selected together. If you need a report showing "All items this customer has bought," you should base it on sales data by using the Sales Document and Sales Document Row tables instead.
Typical combinations are:
- Sales Document + Sales Document Row – e.g. to report sales by product
- Sales Document + Payment – e.g. to make a report that compares sales and payments
- Sales Document + Customer – to report sales by customer group etc.
Example of creating a report:
Sale by Product Report - Sales Document + Sales Document Row
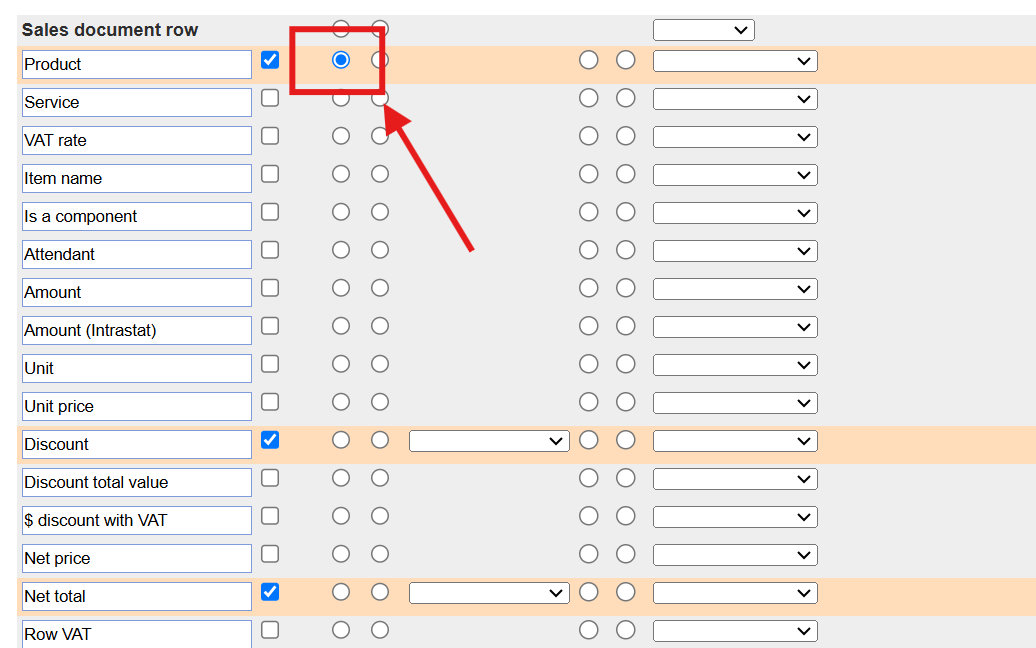
The image below illustrates the process of merging two tables.
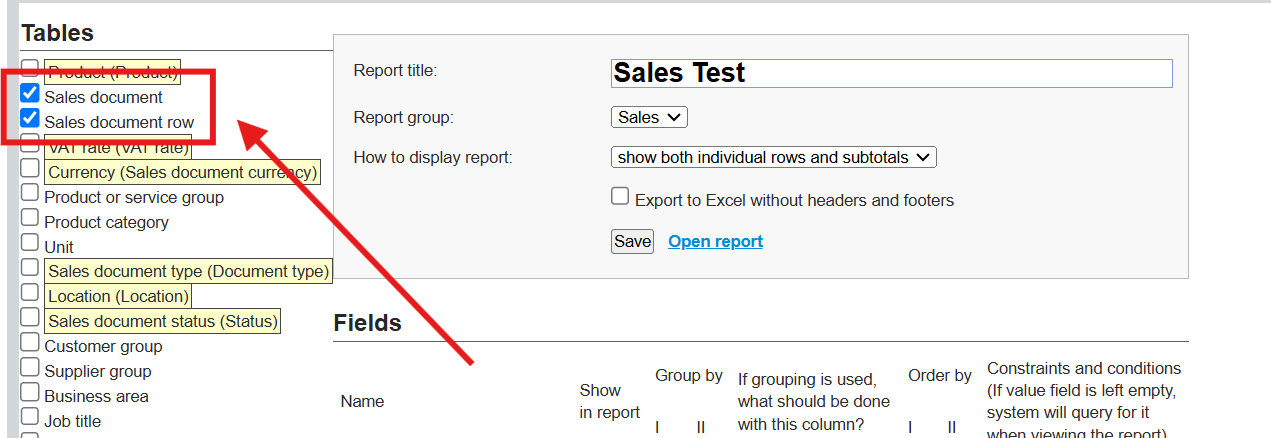
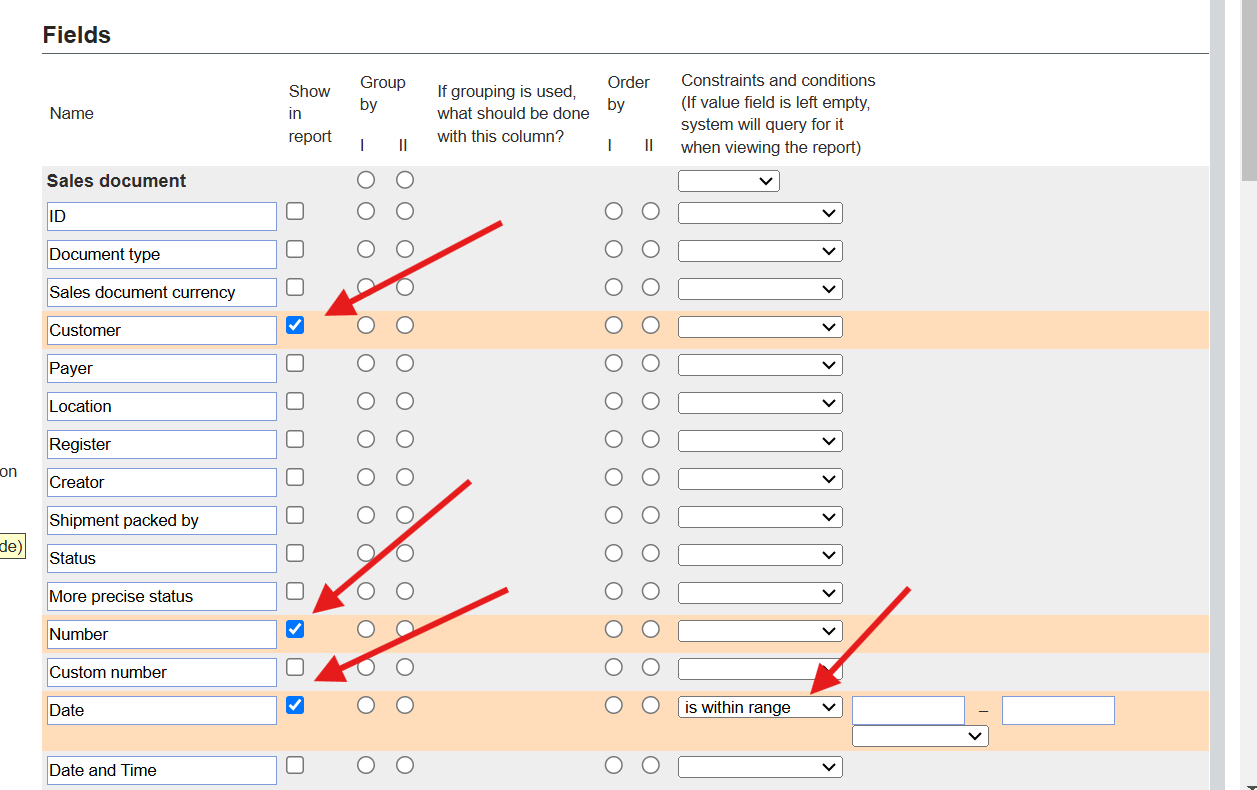
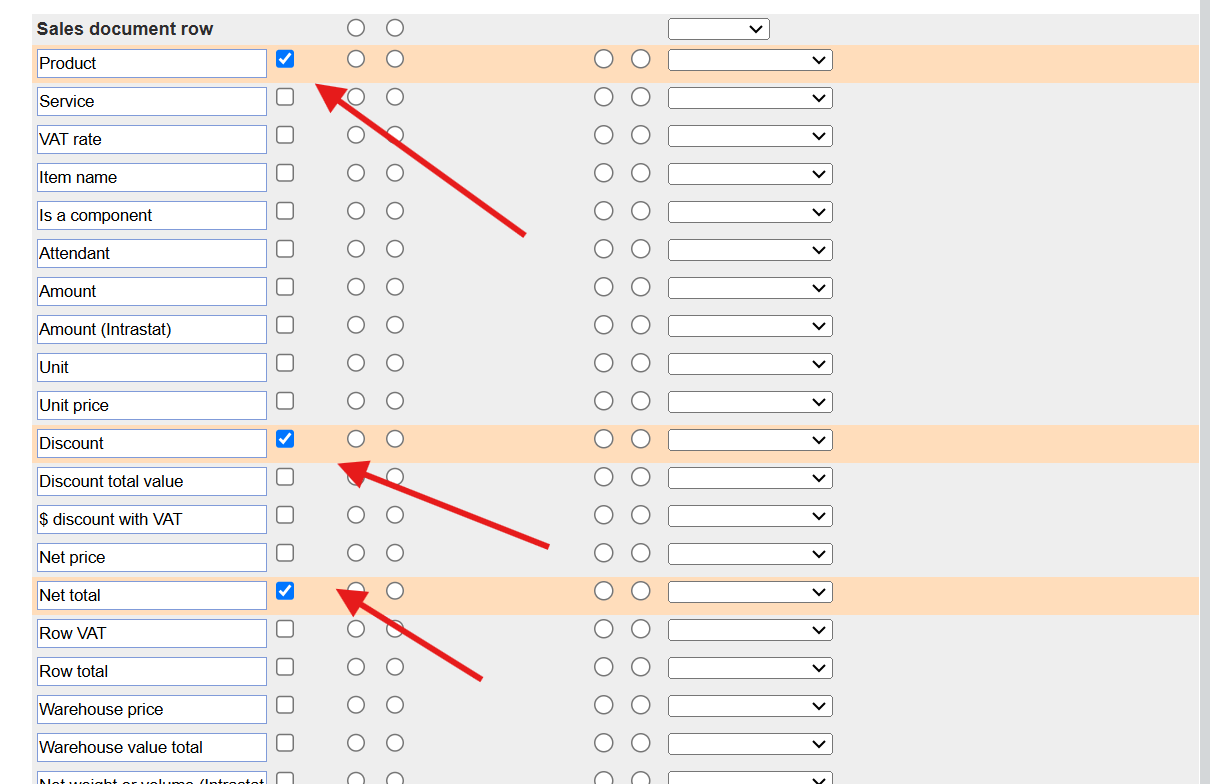
Choose the data to be displayed in the report and put a check mark.
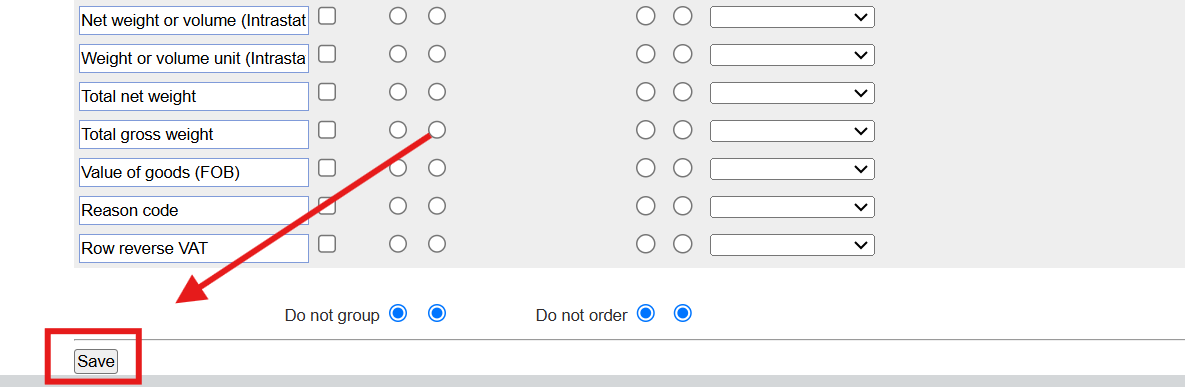
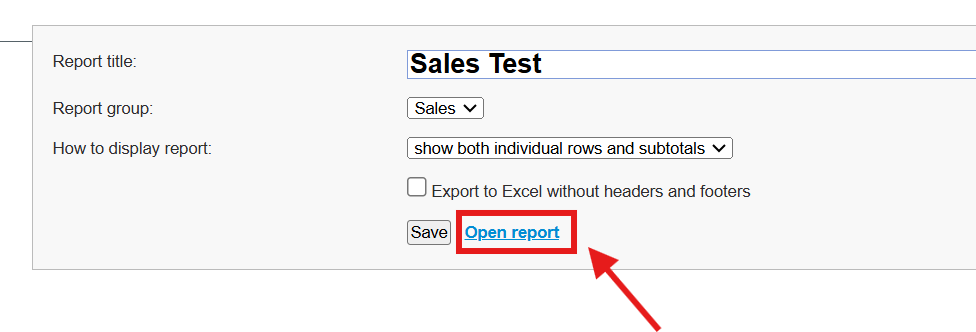
After selecting the required data for the report, click "Save."
To generate the report, click "Open Report" at the top of the page.
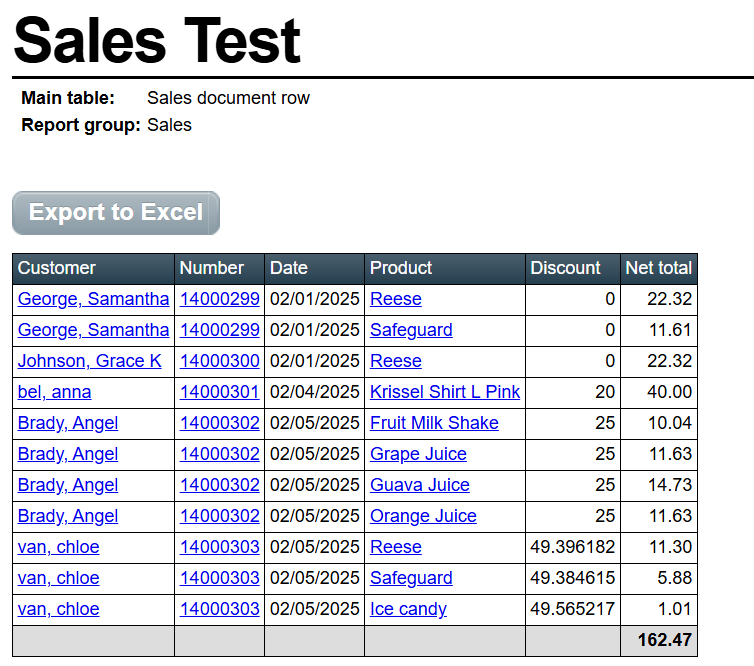
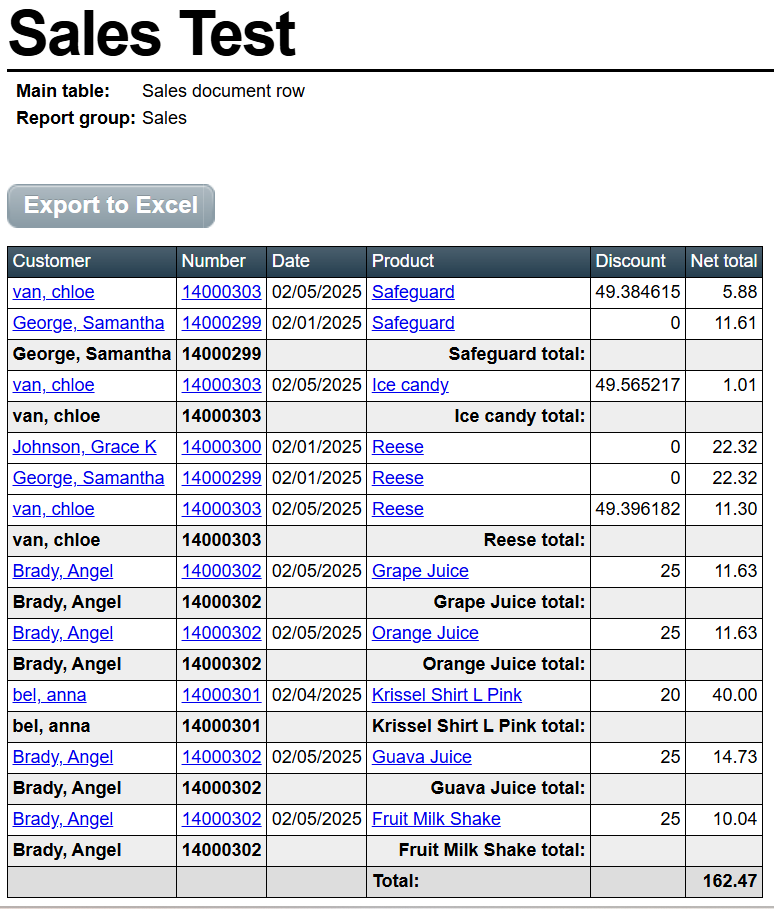
This is what the report appears like.
Grouping the Report
The report is grouped according to your requirements. In the example below, it is grouped by product.
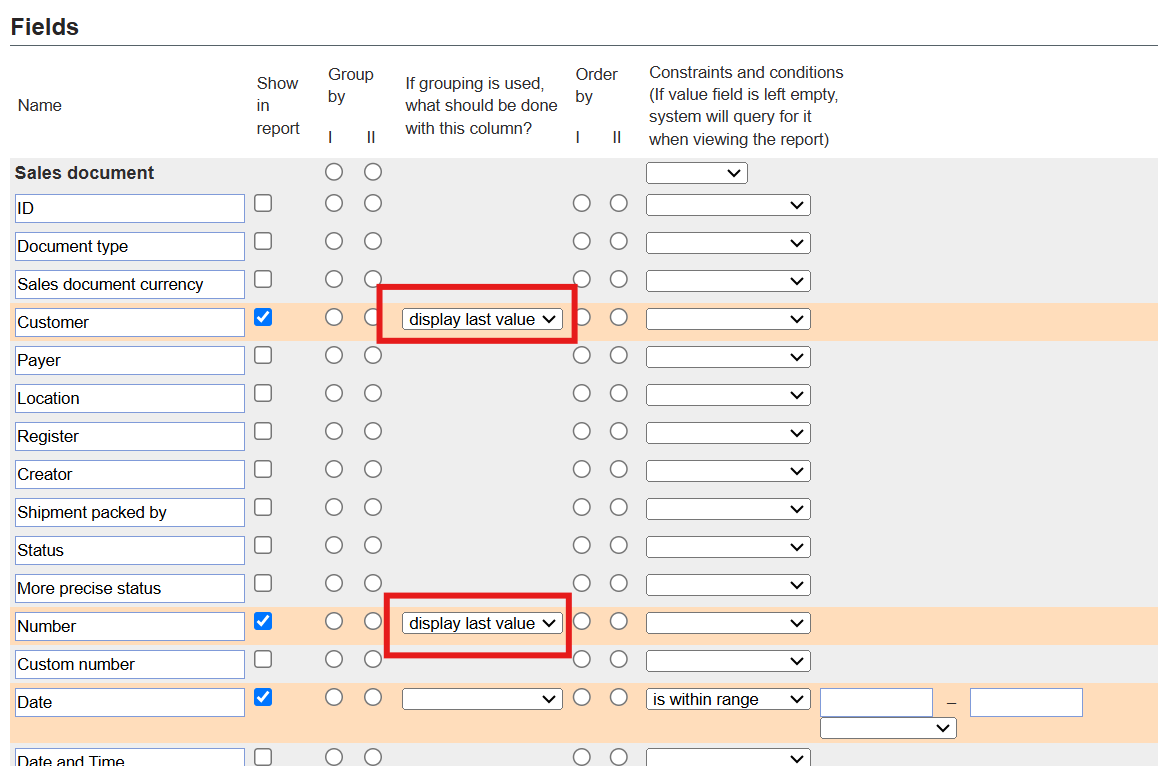
This is how the report appears when grouped.
FAQ:
- Can I save the report as a PDF file? Yes, simply print the report and choose the option to save it as a PDF.
- Can I export the report to Excel? Yes, there is an option to export it to Excel.
- Are there any limitations when generating a custom report? Yes, you can only combine tables that are directly connected.